
Odd Numbers
How SCSU hockey reported attendance got peculiar in the late aughts and early 2010s

This is Part 3 in a series of articles analyzing SCSU hockey attendance throughout the years. Click here for Part 1, and here for Part 2.
It had been over 24 hours since I had gotten any sleep. Perhaps my drowsiness could explain why I failed to realize the historical anomaly that accompanied the St. Cloud State-Denver game played on Friday, December 16, 2011. The day had started well enough. The overnight drive home after a weeklong road trip with friends to Texas promised to be a bit grueling, what with the thousand miles of travel ahead, but dinner and a show at a Waffle House somewhere north of Dallas had been an entertaining diversion. Unfortunately, a tow truck-assisted detour to the loveliest auto shop in Gardner, Kansas to replace a blown-out tire severely pushed back the ETA, and it was looking doubtful that I would get back to St. Cloud for the Huskies game that night. But, loyal season ticket holder as I was, somehow I made it to the church on time. There I faithfully sat in section 203, wearily watching Drew Shore beat Ryan Faragher in overtime to give the Pioneers a 3-2 win.
The footnote not apparent to me at the time was the attendance of 4,125 — by far the lowest reported attendance for a regular-season game at the National Hockey Center in over 12 years. The next night’s game drew an even lower 4,066. While seemingly no one noticed at the time, these attendance figures represented a sudden departure from a historical trend. For over ten years, seating-capacity sellouts had become the norm for regular-season games in St. Cloud. From February 2001 through October 2011, SCSU reported sellouts for 178 of its 187 regular-season home games.1 That all abruptly changed in the middle of the 2011-2012 season. Nearly a decade and a half later, average attendance has continued to hover around the 4,000 range, and sellouts are now a true rarity.
What the heck happened?
Full capacity, defined
Before diving in, it’s important to do some brief table-setting. For the purposes of this research, the term “sellout” represents a game in which the reported attendance was at least 100% of seating capacity at the National Hockey Center. Maximum seating capacity has changed throughout the years, three separate times decreasing as a result of arena renovation projects. It’s therefore edifying to see year-by-year average attendance represented as a percentage of capacity, to account for the changes in maximum seating capacity:
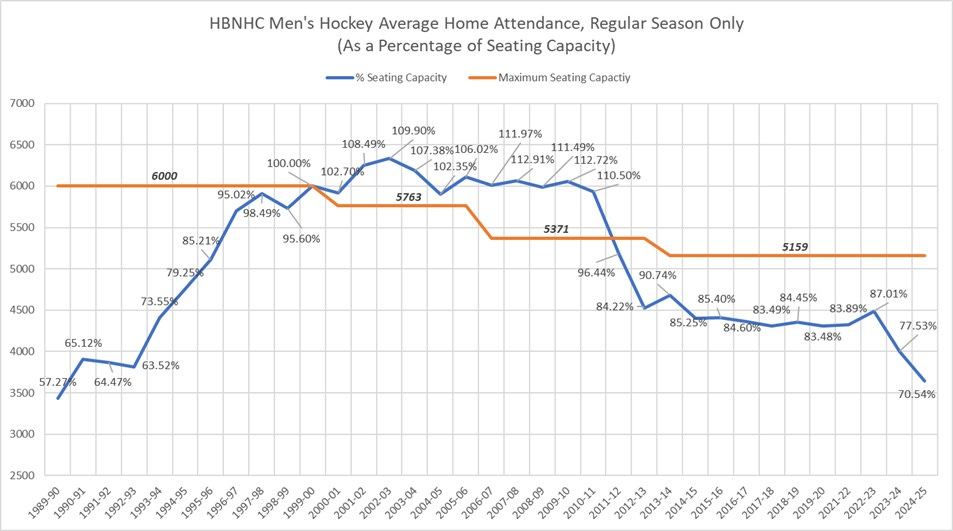
Here is a timeline of the changes made in maximum seating capacity:
Summer 2000: Chairback seats are installed in north-side sections 203, 204, and 205, replacing bench seating. As a result, maximum capacity is reduced by 237 seats, from 6,000 to 5,763.2
Summer 2006: Chairback seats are installed in south-side sections 210, 211, and 212, replacing bench seating. As a result, maximum capacity is reduced by 392 seats, to 5,371.3
Spring 2012-Summer 2013: Major arena renovations occur during the entirety of the 2012-2013 season and the summer of 2013. Suites replace some top-row bench and chairback seating on the arena’s south side. The seats removed plus the new suites results in a net loss of 212 seats, to 5,159, which remains the maximum seating capacity.4
In addition to seating capacity, the standing-room capacity limit came into play mainly when the Huskies hosted Minnesota and North Dakota during the peak attendance years. Maximum standing-room capacity was adjusted down along with the seating capacity changes detailed above, but was as high as 7,051, which SCSU hit on eight occasions between 1990 and 2000. This helps explain the run in the aughts when average percentage capacity exceeded 100% every season.
OK, with that out of the way…
Losses on the ice, losses in the stands
In the last article, a formula for SCSU unlocking capacity attendance was hypothesized, namely the combination of free student admission and competitive team performance. If this formula is sufficient to explain the attendance rise and peak starting with the institution of the free student admission policy in 1995, it also follows that attendance would dip when the team’s performance suffered. This played out during a period of poor team play in the mid-2000s. The resultant decline in actual in-building attendance was noticeable, and clues regarding SCSU’s inexact attendance accounting began to emerge.
The 2004-2005 season was the Huskies’ worst on the ice in ten years. St. Cloud State struggled mightily all season long, finishing 14-23-3 overall and ninth place in the ten-team WCHA. Whereas the National Hockey Center had become a house of horrors for opponents in previous seasons, the 2004-2005 Huskies seemingly inverted that home-ice advantage on themselves, going winless in their last 11 conference home games. Fan angst, manifested in “letters to the editor, Internet postings, [and] booing at home games,” according to one account, had actually been stirring since the second-half collapse of the previous season.5 Ranked in the top five nationwide in the first half of the 2003-2004 season, the Huskies fell apart in February and March, losing their last seven games and missing the NCAA Tournament for the first time in five years. The even-worse 2004-2005 season turned out to be Craig Dahl’s last as head coach.
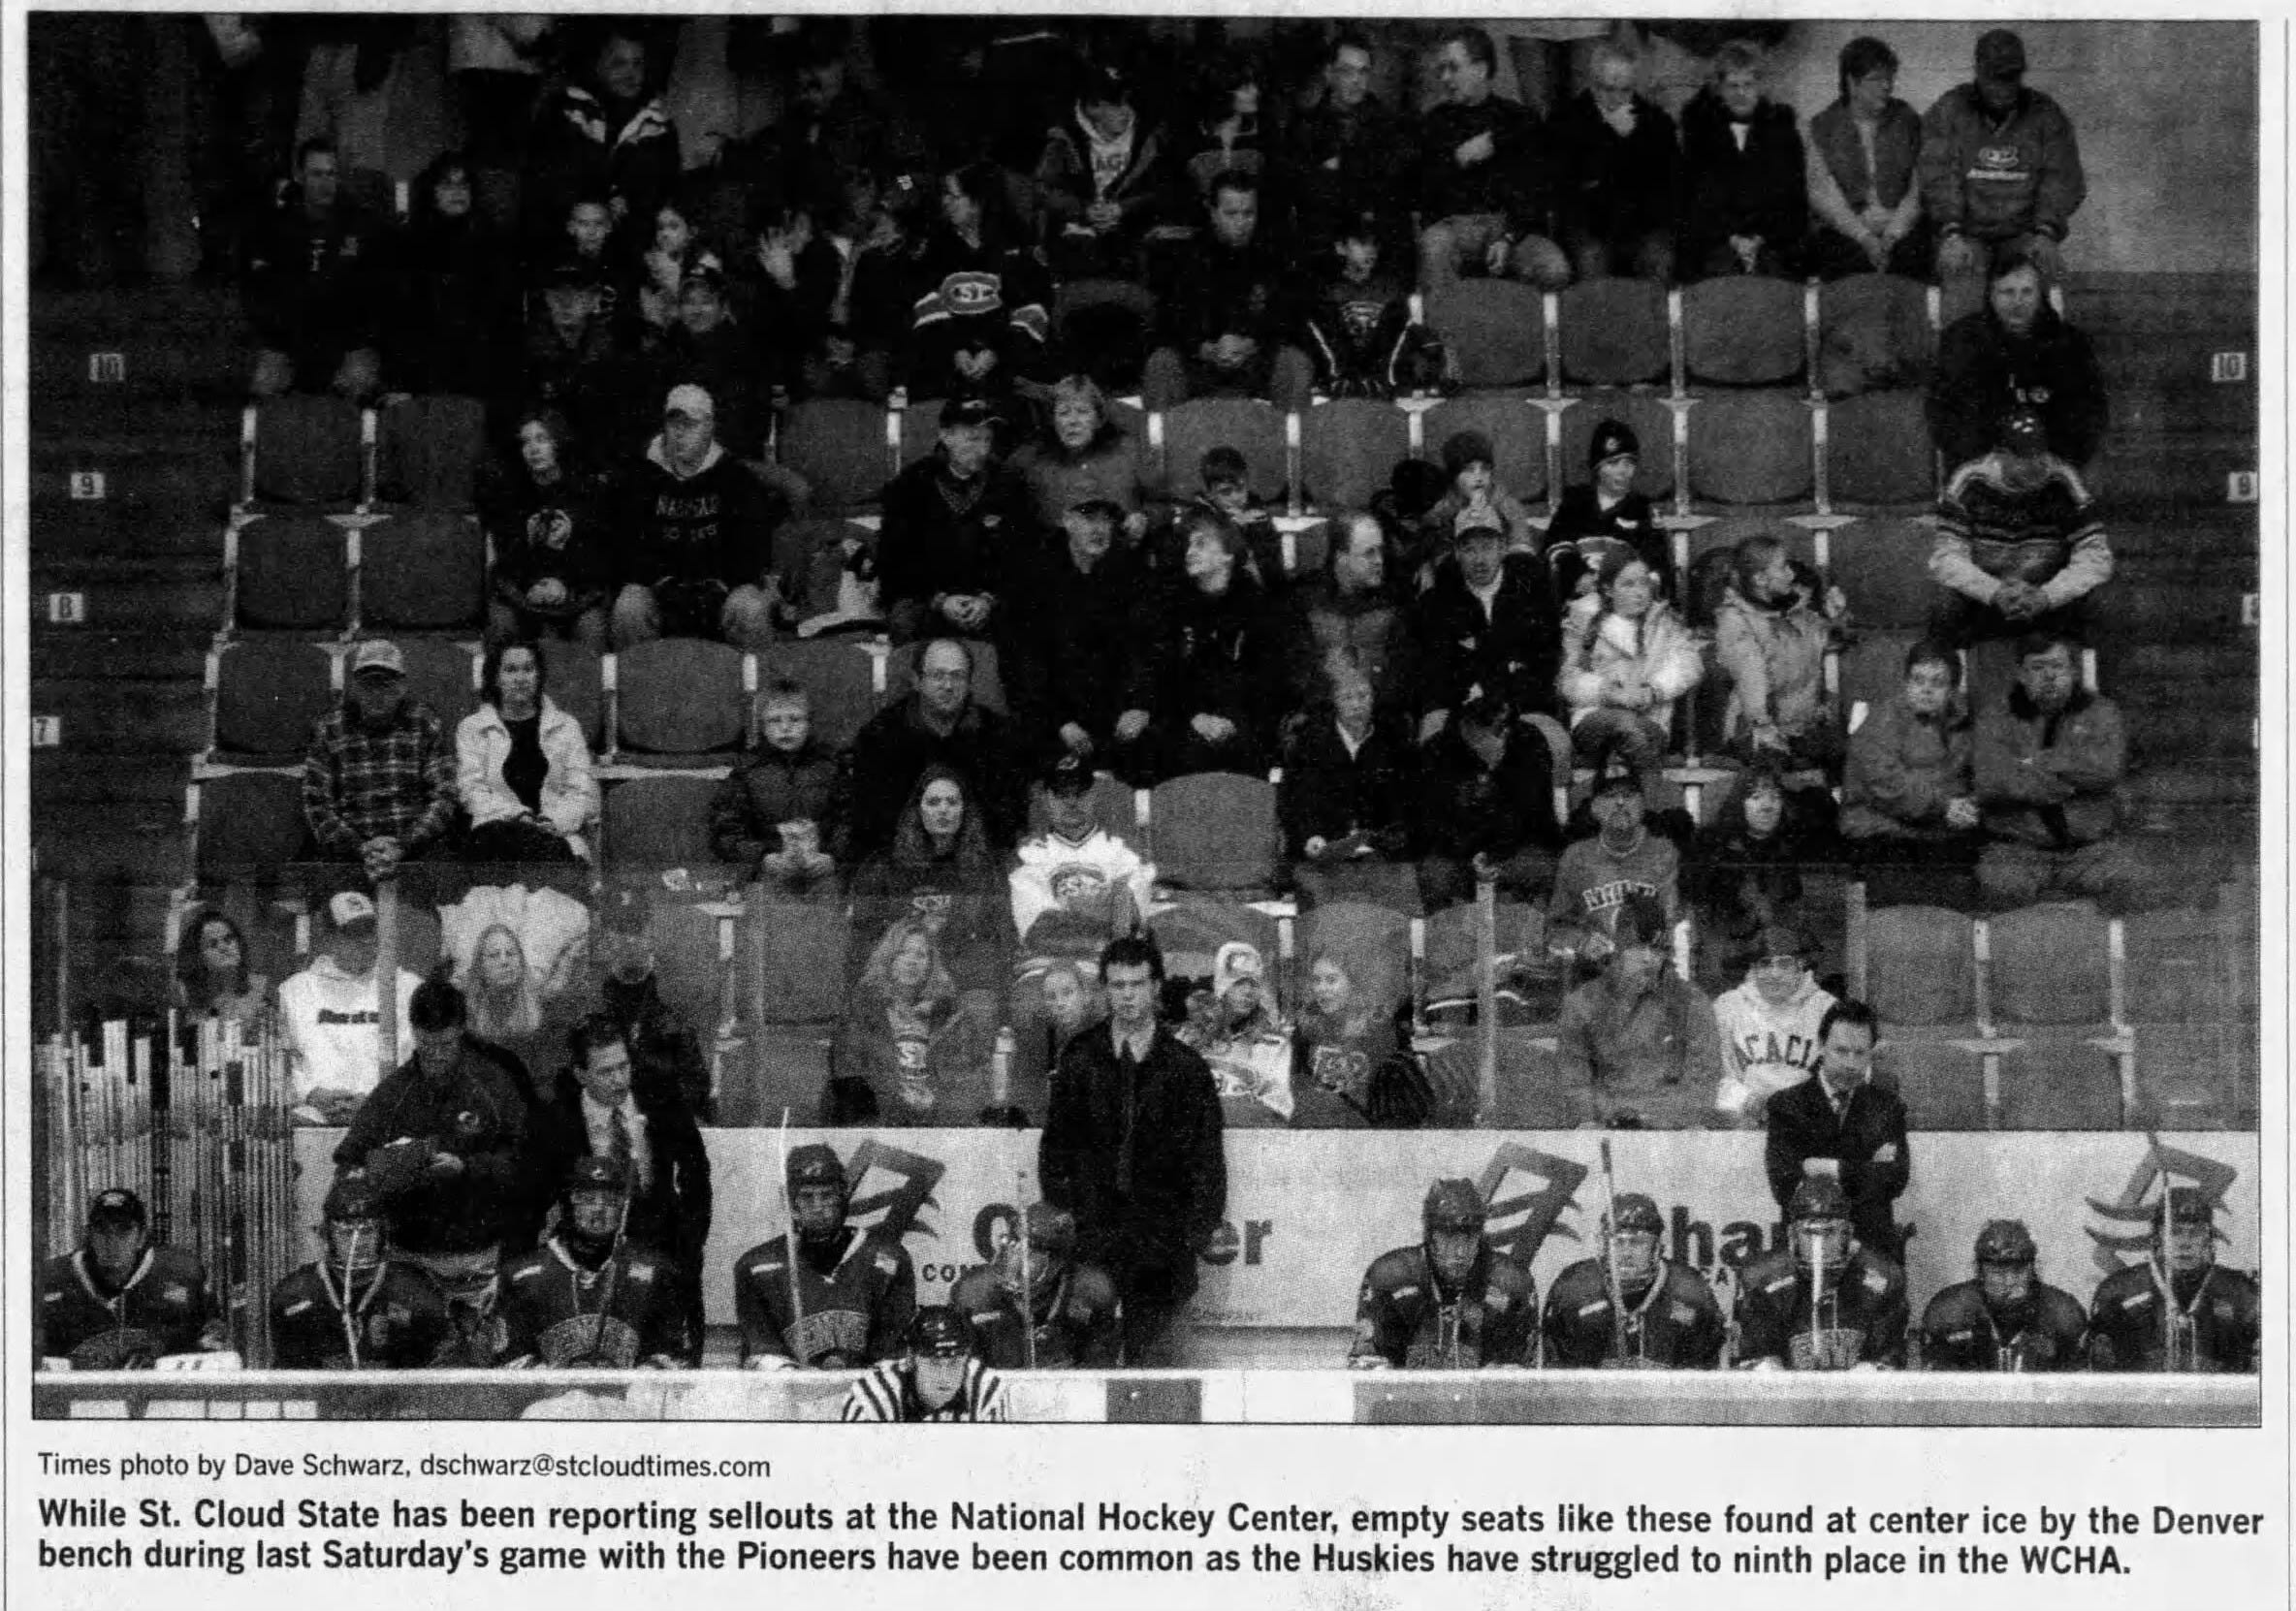
The dismal performance of the team resulted in an emptier National Hockey Center. Average reported attendance dropped by 289 fans per game from 2003-2004 to 2004-2005, the largest single-season decline to that point. While the average attendance in 2004-2005 of 5,899 per game still exceeded seating capacity at that time, keen observers noted the striking difference between the official attendance figures and the actual in-arena population. From one season-ticket holder’s letter to the St. Cloud Times in March 2005: “Although the “reported” attendance is always close to sellouts, they are using “fuzzy” math. The building has been far from full, even when premium teams…[c]ome to town.”6
Reportage in the Times shed more light on attendance issues. Hockey beat writer Kevin Allenspach devoted an entire article to attendance struggles in January 2005. In it, Allenspach reported that student sections in particular “have become sparsely populated,” but that 1,660 student admissions per game were still counted as tickets sold for the purposes of calculating the official attendance figure.7 Overall, Allenspach concluded that “actual attendance is vague,” and in some cases in-person attendance had been “perhaps 2,000 fans fewer” than the number of tickets sold. Athletic director Morris Kurtz acknowledged that the school’s attendance accounting practices were less than comprehensive:
“[K]urtz said the school does not keep actual attendance figures. The official numbers, which have been unannounced to the crowd on hand this season, represent tickets sold. Fans pass through the turnstiles when they enter the arena, but their ticket stubs are thrown away by ushers and counters are not checked.”8
This inexactitude wasn’t limited to the hockey program. In a 1998 Times article on lagging SCSU basketball attendance, Kurtz claimed that student attendance had improved as a result of the 1995 referendum which enabled free student admission to all university sporting events. Kurtz’s basis for making this claim was, as the Times put it, “visual assessment of the crowds.”9
Chad Sheetz, former assistant athletic director of business and ticketing and current general manager of St. Cloud State Sports Properties, confirmed the imprecise accounting of student attendance during his career at SCSU, which began in 2000. “At that time there was really no accurate way to tell exactly how many students were [in attendance] with the exception of [G]opher game[s],” Sheetz explained in an email exchange with Cloud Coverage. “When I first started it was simple, show your ID to get in unless it was for big games,” Sheetz stated. “After that we switched to our first electronic system at which point we counted card swipes.” So prior to the counting of swipes of student IDs, was an actual headcount of students done each game? “I want to say at that time they counted student seating, not necessarily students in the building,” Sheetz wrote.
The picture becomes clearer, as the accuracy of reported attendance becomes murkier. Games against Minnesota and (by the late 1990s) North Dakota produced reliable attendance numbers, as the school required actual tickets in hand from all attendees, students and non-students alike. But all other attendance figures were subject to be inflated, as the student allotment was often not claimed entirely. The big question for Sheetz was: When did the accounting of student attendance change, from one of merely counting the student allotment as a whole to counting individual ID swipes at the gate? Unfortunately, Sheetz couldn’t pin down a firm date. “I can’t remember what year they specifically switched to electronic,” he wrote. “If I were to guess it would have been sometime from 06-11 but I’m not exactly sure.” Well, shucks.
Raising eyebrows
Lack of confirmation aside, it’s clear at the very least that attendance numbers became more suspect during the timeframe Sheetz cited. While the team’s performance varied from good to middling, attendance was curiously stable, throwing into doubt the peak-attendance formula of free student entry and high-quality team play. Bob Motzko was hired as head coach late in the summer in 2005, on the heels of the disastrous final Dahl season which drew attention to attendance issues. In Motzko’s first six seasons, the Huskies made the NCAA Tournament in half of those seasons, finishing as high as second and as low as ninth in the WCHA. Solid, if not spectacular. But the attendance numbers craft a different story, one of a consistent national attendance leader with a fanbase steadfastly loyal even during less-than-stellar seasons. In the six seasons between 2005-2006 and 2010-2011, all but one of the 108 regular-season games at the NHC went in the books as a sellout, and the one non-sellout (December 18, 2005, vs. Robert Morris) was only ten fans short of hitting full seating capacity. It strains credulity to believe this run of sellouts was an authentic achievement, however. Unpacking the data from a few seasons during this era illustrates why.
2005-2006: Motzko’s inaugural season started slowly, as the Huskies were tied for eighth place in the WCHA in mid-January, but ended in a flourish, as SCSU advanced to the Final Five championship game. Average reported attendance bumped up to 6,110 fans per game, an improvement of 211 from the final Dahl season. But per Allenspach reportage after the season, men’s hockey revenue actually fell $50,000 from the 2004-2005 season to the 2005-2006 season, even though the Huskies hosted the same amount of regular-season games in each season (18) and neither team hosted a playoff series.10 In fact, the NHC hosted one additional game in the 2005-2006 season, an exhibition game against Alberta, whereas SCSU did not play an exhibit game in 2004-2005. Exhibition games aren’t included in season averages for attendance, but presumably revenue for the exhibition game was accounted for in the numbers Allenspach obtained. Tickets sold is just one revenue factor, of course, but it is difficult to reconcile a significant attendance increase — the third-highest single-season jump in the free student admission era to that point — with a decrease in overall men’s hockey revenue.
2007-2008: The Huskies finished fifth in conference, but in a very strong WCHA, that was good enough for SCSU to make their second straight trip to the NCAA Tournament. Attendance that season was steady — strangely steady, even. Check out the game-by-game attendance log:
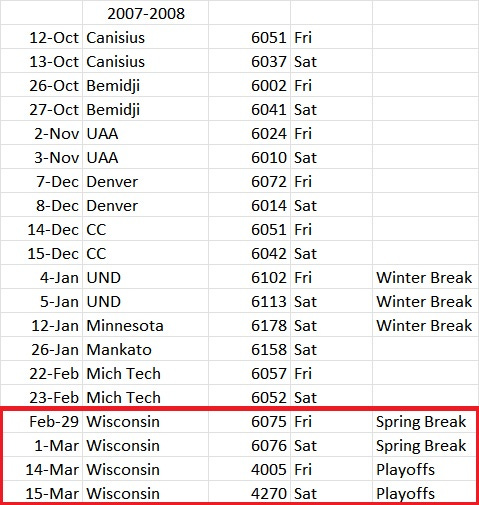
So the lowest reported attendance figure for the entire regular season is 6,002 (keep in mind, seating capacity is 5,371 at this point). The final regular-season series against Wisconsin kept the 6,000+ streak going, even during a Spring Break weekend.11 Two weeks later for the playoffs, hosting those same Wisconsin Badgers and…attendance dropped by 2,000 fans. Remember, free student admission did not apply for WCHA playoff games, so students were required to purchase playoff tickets. In the previous season’s playoff series versus Minnesota-Duluth, the NHC drew crowds of 5,556, 5,576, and 6,012 for the three games, each of which set a new record for playoff attendance in the arena’s history. But a year later, with no change to the student entry policy, SCSU wasn’t able to crack 4,300 for either playoff game. As playoff tickets sold are more reliable data than regular-season figures, it’s more likely that the regular-season average of 6,064 was inflated.
2008-2009: This season was a step back for SCSU in terms of competitiveness. The Huskies missed the NCAAs after back-to-back appearances, and finished just one game above .500, and that due in large part to feasting on a soft non-conference schedule. Like the season before, attendance is questionably stable, especially so considering the more mediocre team performance:
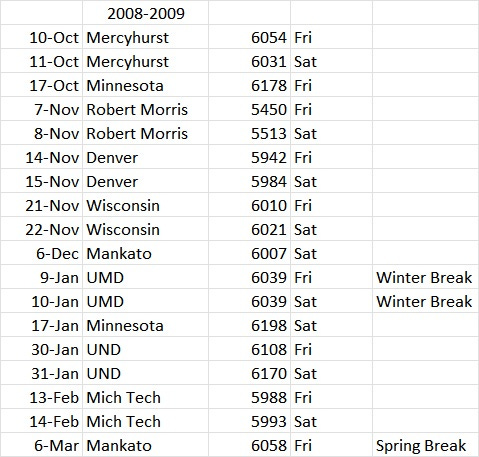
Again, 100% of home games were reported sellouts. Aside from the outlier series against Robert Morris in November, attendance figures vary only slightly, with all games reporting between 5,900 and 6,100 fans. What’s more, this season played out against the backdrop of the developing nationwide recession, with the 2008 financial crisis having unfolded just before the season’s onset. Attendance figures for all spectator sports, including college hockey, were negatively affected by the economic contraction.12 But even during a ho-hum season, St. Cloud State’s hockey attendance was seemingly immune from such macroeconomic factors. SCSU’s average attendance of 5,988 was good for the seventh-best per-game mark across the country, matching its highest nationwide rank in school history.13
2009-2010: The early Motzko period falls within the YouTube era, meaning it’s possible to find video evidence that could help support or disprove the validity of attendance numbers. After a fair amount of searching, there are a good number of Husky hockey video clips from this era of varying quality, though most do not feature clear shots of the crowd. The best example is probably this one from October 17, 2009. Here’s a useful screenshot from the 0:12 mark of that video:
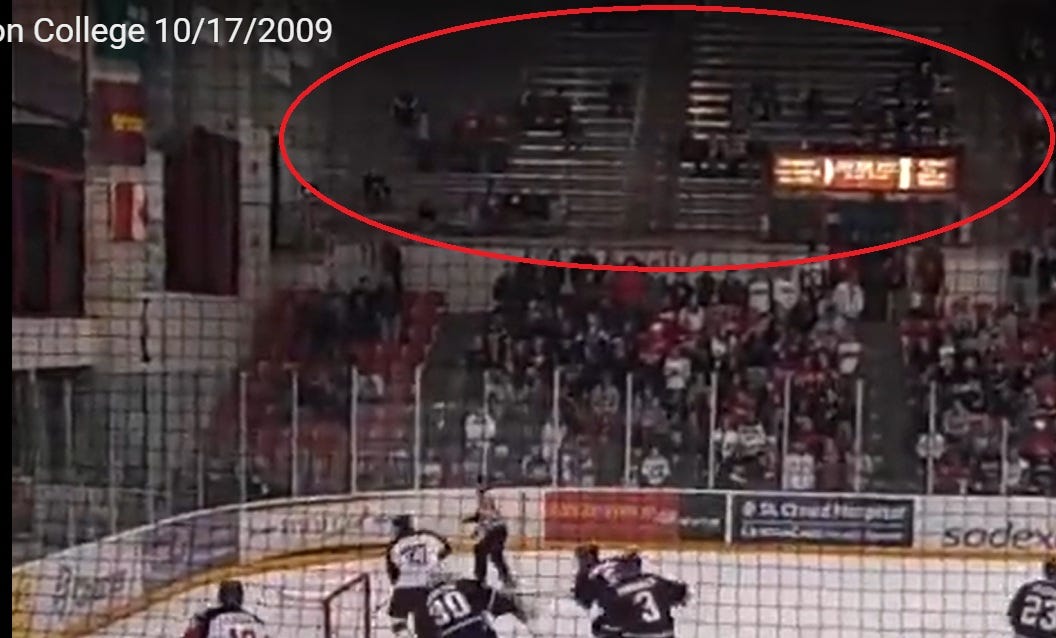
The video was recorded from the Dogg Pound during the middle of the third period in what turned out to be a 3-1 Huskies win over Union. The area circled above depicts the student sections 213 and 214. The capacity of those two sections total 486 seats, assuming the NHC’s original blueprints are accurate.14 It’s not the clearest screenshot, but there are maybe 50 people occupying those sections, and that’s being generous. Reported attendance for this game was 5,933, yet another sellout, more than 500 above maximum seating capacity in fact. A visual assessment of said “sellout” crowd, however, leaves this writer more than a bit skeptical. Counting the student sections among the number of tickets sold, even if some were mostly empty, is the best explanation for the disparity between the reported numbers and the eye test.
2011-2012: Here’s where the data go off the rails. To wit:
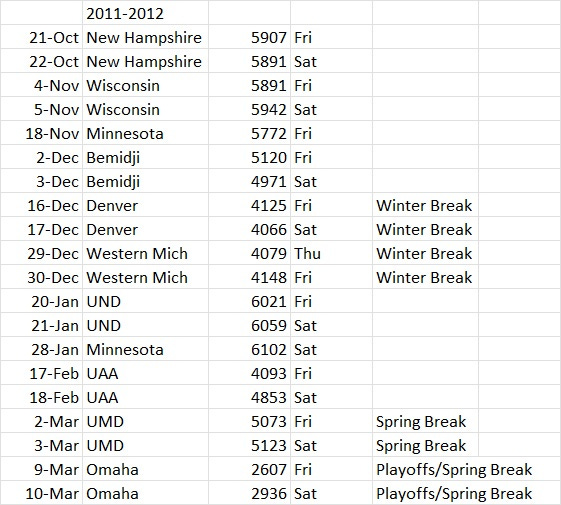
The first four home games continued the narrative of steady capacity-plus attendance. Then things got weird. The attendance of 5,772 for the Gopher game on November 18 is likely legitimate, considering that students needed to pick up tickets in advance of the game. But for the Gopher game to draw a smaller crowd than any of the four games preceding it is baffling. Since Minnesota’s debut at the NHC in 1990, the Gopher games were the #1 draw for SCSU every single year that they played in St. Cloud. Only once before had the Gophers not drawn at least a seating-capacity sellout, and there was a good reason for that anomaly: it took place on November 1, 1991, the day after the Great Halloween Blizzard of 1991.15 While the 5,772 attendance for the 2011 game was still a seating-capacity sellout, juxtaposing it with the numbers from the previous games is a telling indicator that the reported attendance figures for the New Hampshire and Wisconsin games were inflated. From there the decline worsened, next with the Bemidji State series, and then the fateful Denver series in December. From this point on, attendance is much more reliant on specific opponents, with in-state rivals and North Dakota attracting the most fans, while lower-profile visitors like Alaska-Anchorage struggled to draw impressive crowds.
There are enough indications from the above data to reasonably assert that the switch to the electronic swipe system of counting student attendance (the date of which Chad Sheetz could not pin down) occurred sometime in November or December of 2011. If true, this would mean that, instead of the precipitous drop in attendance in 2011-2012 as the reported attendance suggests, the decline actually occurred gradually across several seasons, potentially starting as far back as the Craig Dahl era. While the drop in attendance is a real and serious issue for SCSU to address, it’s also important to understand that the decline wasn’t as dramatic as the reported attendance data indicate. Indeed, this framing makes the task of righting the ship that much harder. A long, drawn-out decline is more likely to be multicausal and systemic in nature, and therefore more difficult to grapple with than a one-season blip in the radar.
A change in attendance wasn’t all that was going on in 2011, however. In many ways, 2011 was the most tumultuous year in the history of SCSU hockey at the Division I level. Conference realignment was just one of the storylines that converged that year. The events that unfolded and the decisions the SCSU administration made back then directly impacted hockey attendance and continue to have ripple effects still felt today. There’s a lot to dig into, so the next article will be focused entirely on that weird year of 2011. ‘Til next time!
Subscribe to Cloud Coverage to get new articles sent directly to your inbox!
As mentioned in a previous article, an attendance number for the 2/14/2004 game versus Bemidji State cannot be obtained and is not included in this total, although it’s nearly certain that it would have been a reported sellout.
Allenspach, Kevin. “Renovations are in store for arena.” St. Cloud Times, 22 January 2000, p. 6D.
Allenspach. “Huskies’ revenue down slightly in ’05-06.” St. Cloud Times, 27 July 2006, p. 1D. The article mentions seating capacity would reduce to 5,531, but by the start of the 2006-2007 season, the Times listed a seating capacity of 5,371. See Game preview. “St. Cloud State vs. Denver.” St. Cloud Times, 13 October 2006, p. 4D.
St. Cloud State University. 2014-15 Huskies Hockey Media Guide and Team Records, p. 4. The 2013-14 media guide erroneously lists the old capacity figure of 5,371, but it’s corrected the next year.
DeLand, Dave. “Dahl can handle the heat.” St. Cloud Times, 10 February 2005, p. 1D.
Kenneth Daly letter to the editor. St. Cloud Times, 20 March 2005, p. 9D.
This indicates that at some point the student allotment had shrunk from the original 2,000 that was in place upon the passage of the 1995 referendum. Allenspach. “Good seats still available.” St. Cloud Times, 27 January 2005, p. 4D.
Allenspach, loc. cit., p. 1D.
Cook, Robin. “With sluggish attendance, St. Cloud State figures out ways to sell itself.” St. Cloud Times, 6 February 1998, p. 5C.
Allenspach. “Huskies’ revenue down slightly in ’05-06.” St. Cloud Times, 27 July 2006, p. 1D, 4D.
Spring Break information derived from Undergraduate Bulletin 2006-2008. St. Cloud State University, p. 7. Accessed via repository.stcloudstate.edu/archives on August 14, 2025.
Total attendance for the WCHA Final Five dropped 6,000 fans from 2008 to 2009, and an additional 11,000 fans from 2009 to 2010. Data obtained from uscho.com and collegehockeystats.net reported attendance figures.
The Huskies were also 7th nationwide in attendance in the 2005-2006 season. Data obtained from uscho.com and collegehockeystats.net reported attendance figures.
“National Hockey Center drawings part 01.” St. Cloud State University Archives and Special Collections, National Hockey Center, https://archives.stcloudstate.edu/index.php/national-hockey-center, accessed 13 August 2025.
The schools had discussions about postponing the St. Cloud half of the home-and-home to Sunday due to the blizzard, but the Friday game ended up going off as scheduled. See Gilbert, John. “Delay doesn’t slow ‘U’ from quick start.” Minneapolis Star Tribune, 2 November 1991, pp. 1C, 9C.