
Lagging Indicators
Attendance for St. Cloud State men's hockey is trending in the wrong direction. What to make of it?

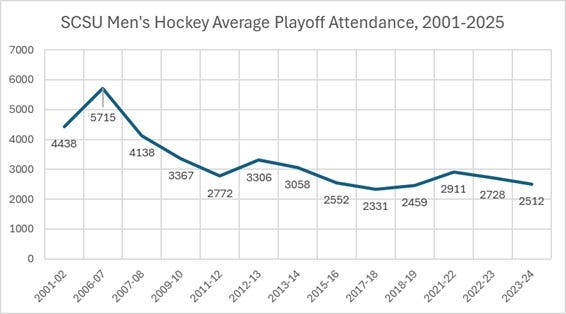
On the latest episode of the Huskies Hockey Podcast, one of the topics discussed was the declining average attendance at St. Cloud State men’s hockey games since the 2001-2002 season. If you’re a fan of upward-trending infographics, the results weren’t pretty. To wit:

So, first, the big picture: since 2001, average home attendance has plummeted — a 47% drop from the 2002-2003 peak to the 2024-2025 nadir. Narrowing the time frame to span the thirteen seasons1 since 2010-11, attendance has dropped nearly 39%. To narrow the time frame even more, the last two seasons were the first since 2001 in which the average attendance dipped below 4,000 fans per game. In the absence of data prior to 2001, I felt it was reasonable to assert that the 2024-2025 season represented the lowest per-game attendance in the history of the Herb Brooks National Hockey Center (HBNHC), which opened in December of 1989.
The robust discussion regarding these attendance data on the podcast continued to social media upon posting the above graph on X. Theories on what could explain such a drop started coming in, which echoed much of the speculation offered during the podcast. Several reactions focused on the period around 2011 when the most precipitous drop occurred, the average falling by nearly 1,000 fans per game from the 2010-2011 season to the 2011-2012 season. My attention was similarly gripped by trying to understand what was going on at that time that could account for such a sharp decline. Here’s a list of some of the various hypotheses for the attendance dip that have been offered:
Declining student enrollment, particularly at SCSU but also on a broader, nationwide scale
Early 2010s conference realignment which resulted in SCSU’s men’s team moving from the WCHA to the NCHC
Expanded availability of SCSU games aired on TV and/or streaming
Rising ticket prices
Stagnating economic and population growth of the city of St. Cloud
Alternate options for hockey fans within the St. Cloud area, namely the NAHL’s St. Cloud Norsemen and the NA3HL’s Granite City Lumberjacks
In the midst of the podcast discussion of some of these factors, my cohost Weldie threw an unexpected curveball: how did the school account for student attendance? SCSU students receive free admission to all athletic events, but it’s not entirely clear how student attendance is factored into the reported attendance figures. Perhaps the school at some point changed their method of factoring students into attendance. Could this change in accounting have made the attendance decline appear more drastic?
At first, I was flummoxed. In a sense, Weldie’s suggestion attempted to invalidate the data and cast doubt on all the various theories bulleted above. It would be quite the letdown if the decline in attendance turned out not to be a reflection of big-picture trends, but rather a result of a change in accounting practices, a mere imprecision that has since been corrected.
My initial presumption was that any change in the accounting of student attendance wasn’t a significant factor in the decline. Perhaps a change had been made at some point, but it wouldn’t have distorted the numbers to the degree that the decline wasn’t reflective of reality. There is an exception to SCSU’s policy of free student admission: conference playoff games, which require students to purchase a ticket to gain entry. All playoff ticket revenue is collected by the conference (for St. Cloud State, this was the WCHA until 2013, and has been the NCHC since 2013). Any fuzzy accounting of student attendance during the regular season wouldn’t apply for the playoffs. Therefore, playoff attendance figures are reliable “tickets sold” numbers, and the data show that average home playoff attendance has followed a similar downward trajectory across the same time period:2
However, I felt compelled to explore the issue of student attendance further. Perhaps I was motivated by a desire to ensure that the mental energy I had already expended on the topic hadn’t been wasted on such a mundane rationale, that the counting of student attendance had simply become more exact. Such a discovery would evoke the disappointment of Ralphie in A Christmas Story, who, dogged in his determination to crack the secret decoder ring, was crushed to realize that its deepest wisdom to impart was “be sure to drink your Ovaltine.” In a way, it brought me to back the most basic questions: what exactly are these attendance numbers? And can those numbers be trusted to the extent that we can attempt to derive any important conclusions from them?

Clearly more research was needed. Most important, the data set needed to be expanded to include the entirety of SCSU’s tenancy at the HBNHC since 1989. How the school factored in student attendance also needed to be verified. Any further analysis of any of the theories in the bulleted list above could only be done after confirming the data set was complete and reasonably reliable.
Now having conducted more extensive research, it’s evident that two of my initial presumptions weren’t accurate. For one, this past season’s average attendance was not the lowest in the HBNHC’s history. On a per-game average, the worst season attendance-wise was the arena’s inaugural year, the 1989-1990 season. Per-game average attendance didn’t surpass 4,000 until 1993-1994, the Huskies’ fifth season at the National Hockey Center. The current era of sluggish attendance isn’t unprecedented.
Second, I was wrong to hand-wave away the significance of a change in how students were counted for attendance purposes. I’ve confirmed that there indeed was a change in how SCSU factored students into reported attendance. Furthermore, the period of highest attendance at the HBNHC (roughly 1995-2011) correlates with the period in which the accounting of student attendance was the least precise. Details are still murky and more research is needed. But it is reasonable to claim that there is a degree of inflation in the attendance numbers during at least some of those peak years of 1995-2011.
To set the table for further analysis, it’s important to unpack these observations. The remainder of this article will focus on the expanded data set dating back to 1989. The next article in this series will explore the issue of student attendance accounting.
Expanding the data set
The initial data set was obtained primarily from year-by-year attendance data reported on United States College Hockey Online (USCHO), which has maintained annual NCAA hockey attendance figures since the 2001-2002 season. Box scores available on College Hockey News verified the USCHO numbers and allowed for attendance numbers to be gathered on a game-by-game basis.
Expanding the scope of research back to the late 1980s required some extra digging. The no-longer-updated College Hockey Stats stretches back to the 1999-2000 season, which enabled the scraping of attendance numbers for that season and the 2000-2001 season. Attendance data for games prior to 1999 was unlocked upon the discovery of Newspapers.com, essentially a massive online microfilm library, whose archives included the St. Cloud Times. I glanced at the 1998 archives and saw box scores complete with attendance numbers — jackpot! Let the research commence.
It turned out to be a tougher task than originally thought. The 1998-1999 season appears to be the first season in which the box scores printed in the Times included an attendance figure. Prior to that, game stories would typically include the reported attendance.3 But there were some instances in which the game story didn’t include an attendance number. Worse still, Newspapers.com has a gap in its St. Cloud Times archive, a gap which spans all of 1991 and the first half of 1992. Most of these gaps in attendance data were filled by consulting other sources such as the Grand Forks Herald, the Duluth News Tribune, the Minneapolis Star Tribune, and the Anchorage Daily Times, whose game stories written by the beat writers of Huskies opponents would sometimes include an attendance figure when the Times did not. The Wisconsin State Journal was the most helpful in obtaining detailed box scores for WCHA games that didn’t involve their hometown team. In all, attendance figures were obtained for all but five of the 231 SCSU games played at the HBNHC between 1989 and 2001. (EDITED 7/9/2025: Thanks to the help of SCSU archivist Tom Steman, who provided scans of SCSU season yearbooks that filled in the remaining gaps between 1990-1992. The only remaining game for which attendance data could not be located is the 2/14/2004 game vs. Bemidji State. More details in footnote 5 below.)
Acknowledging that the gathering of pre-2001 attendance data is not quite 100% complete (EDITED 7/9/2025: It is now!), here’s a graph that encompasses the entire history of the HBNHC:
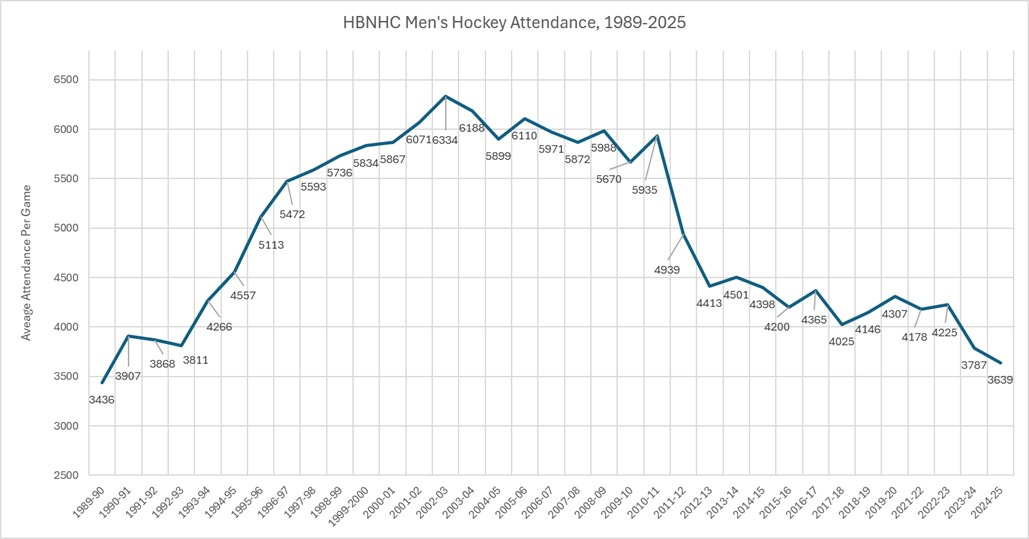
This expanded data set4 paints a somewhat different picture. Instead of the stairstep-like decline depicted when the data started with the 2001-2002 season, the fuller data set illustrates something more akin to a plateau or a mesa, with both a sharp upturn and a sharp downturn bookending a sustained period of high attendance. The sub-4,000 per-game average seen in the last two seasons isn’t so much attendance hitting rock bottom, but rather a regression back to the attendance level seen some thirty years ago, when the HBNHC was still new and the hockey program was still fledgling at the Division I level.
The illustration is similar when only considering attendance at home playoff games, which, as discussed above, are exempt from the regular-season policy of free student admission:
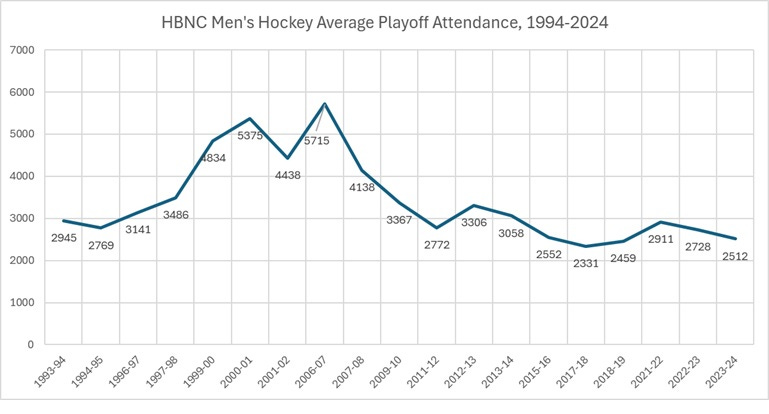
For each of the 19 playoff series played at the HBNHC between 1994 and 2024, average attendance was lower than that season’s regular season average. All told, attendance at HBNHC playoff games has been about 30% lower than the regular season average across all 33 seasons.
So playoff games drag down the overall season average. Because the overall season average isn’t dragged down in seasons that the Huskies failed to host a playoff series, there is an inconsistency in these data. To iron out this inconsistency, it’s illuminating to isolate regular season average attendance since 1989.5
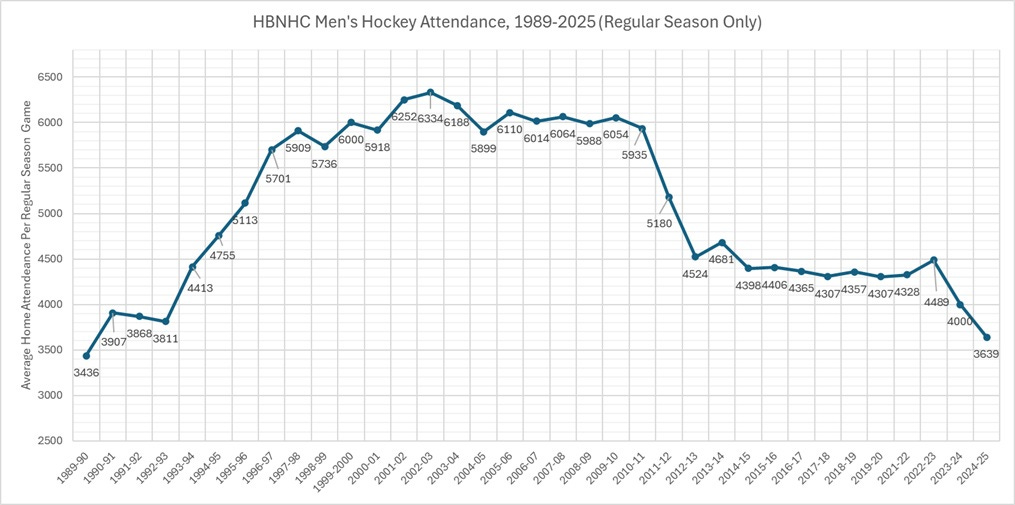
No drastic changes in the overall trends, but this graph is freer of single-season bumps and dips affected by playoff games. It’s particularly interesting how relatively stable HBNHC attendance was during the first ten seasons of the NCHC, which launched in 2013.
To be sure, the main takeaway derived from the initial data set, which dated back to 2001 — that HBNHC attendance is in the midst of a troubling decline — isn’t refuted by the expanded data set. But the fuller picture provides more context and can better inform the analysis of the various factors that have contributed to the decline.
In the next article, I’ll examine how student attendance has been accounted for. As previously mentioned, my initial finding is that there have been changes in how students were factored into the attendance figure, and that those changes were significant enough to skew the overall data. The history of how free student admission came to occur at SCSU is enlightening as well. Stay tuned!
This is the first in a series of articles which examines hockey attendance trends at St. Cloud State. Subscribe to Cloud Coverage College Hockey to get future articles sent directly to your inbox!
The 2020-2021 season is not included in the data, due to the COVID restrictions imposed that severely limited attendance across all sporting venues worldwide.
SCSU didn’t host playoff series every season, of course, so these numbers are only for the 13 playoff series that SCSU has hosted since the 2001-2002 season.
Grateful hat-tip to former Times beat writer Mike Killeen, whose game stories would usually feature the attendance number in the first two or three paragraphs.
Exhibition games are excluded from yearly averages. Also excluded was the 3/7/1993 Huskies-Gophers game at the Target Center in Minneapolis, which had a reported attendance of 12,232. The Huskies were considered the home team and received the gate revenue for hosting the game. However, for consistency’s sake, only games at the HBNHC were included in this data set.
The 2/14/2004 game vs. Bemidji State is listed as “N/A” for attendance in the St. Cloud Times and on College Hockey Stats, and none of the above-mentioned newspaper sources nor the annual SCSU hockey yearbook, which usually listed game-by-game attendance for the previous season. USCHO factored the game in its average, however, essentially counting it as a “zero”. I removed the game from the average. These two adjustments bumped up the average attendance by about 300 fans per game for the 2003-2004 season.
Fine work!